In theory, understanding why opportunities are won or lost seems deceptively simple. In practice, the signal is scattered across loosely enforced CRM fields, free-text notes, and hours of recorded conversations.
On a small scale, experienced operators can manually piece these inputs together and form a narrative, but as deal volume grows, manual reviews become slower and inconsistent, and that approach collapses. Different analysts draw different conclusions from the same data and unstructured feedback overwhelms structured reporting. By the time insights reach leadership, they are often stale, subjective, or impossible to trace back to the original source.
At Drata, we reached a point where the core problem was no longer visibility, but repeatability. We needed a system that could ingest messy, real-world signals and produce the same answer every week, quickly enough to act on and with enough transparency to trust.
We solved this by treating win/loss analysis as a data platform problem, not a reporting exercise. Accordingly, we built a Snowflake-native pipeline that centralizes structured and unstructured data, applies deterministic transformation logic, and uses language models in tightly scoped roles to turn raw signals into explainable, actionable insight. Read on to learn how we did it.
The Problem with Manual Win/Loss Analysis
In most organizations, win/loss insight begins with exported spreadsheets and CRM fields that were not designed with analytical rigor in mind. Analysts attempt to reconcile structured attributes with subjective notes and conversation snippets, so even with experienced operators, the process is slow and brittle.
Before automation, weekly coverage of closed opportunities often hovered around 20 to 30 percent. After introducing an automated pipeline, coverage consistently exceeded 85 percent, with insights available within hours of week close. More importantly, outputs became consistent across time, which allowed teams to uncover trends based on reason rather than debate interpretations.
A Repeatable Architecture for Win/Loss Intelligence
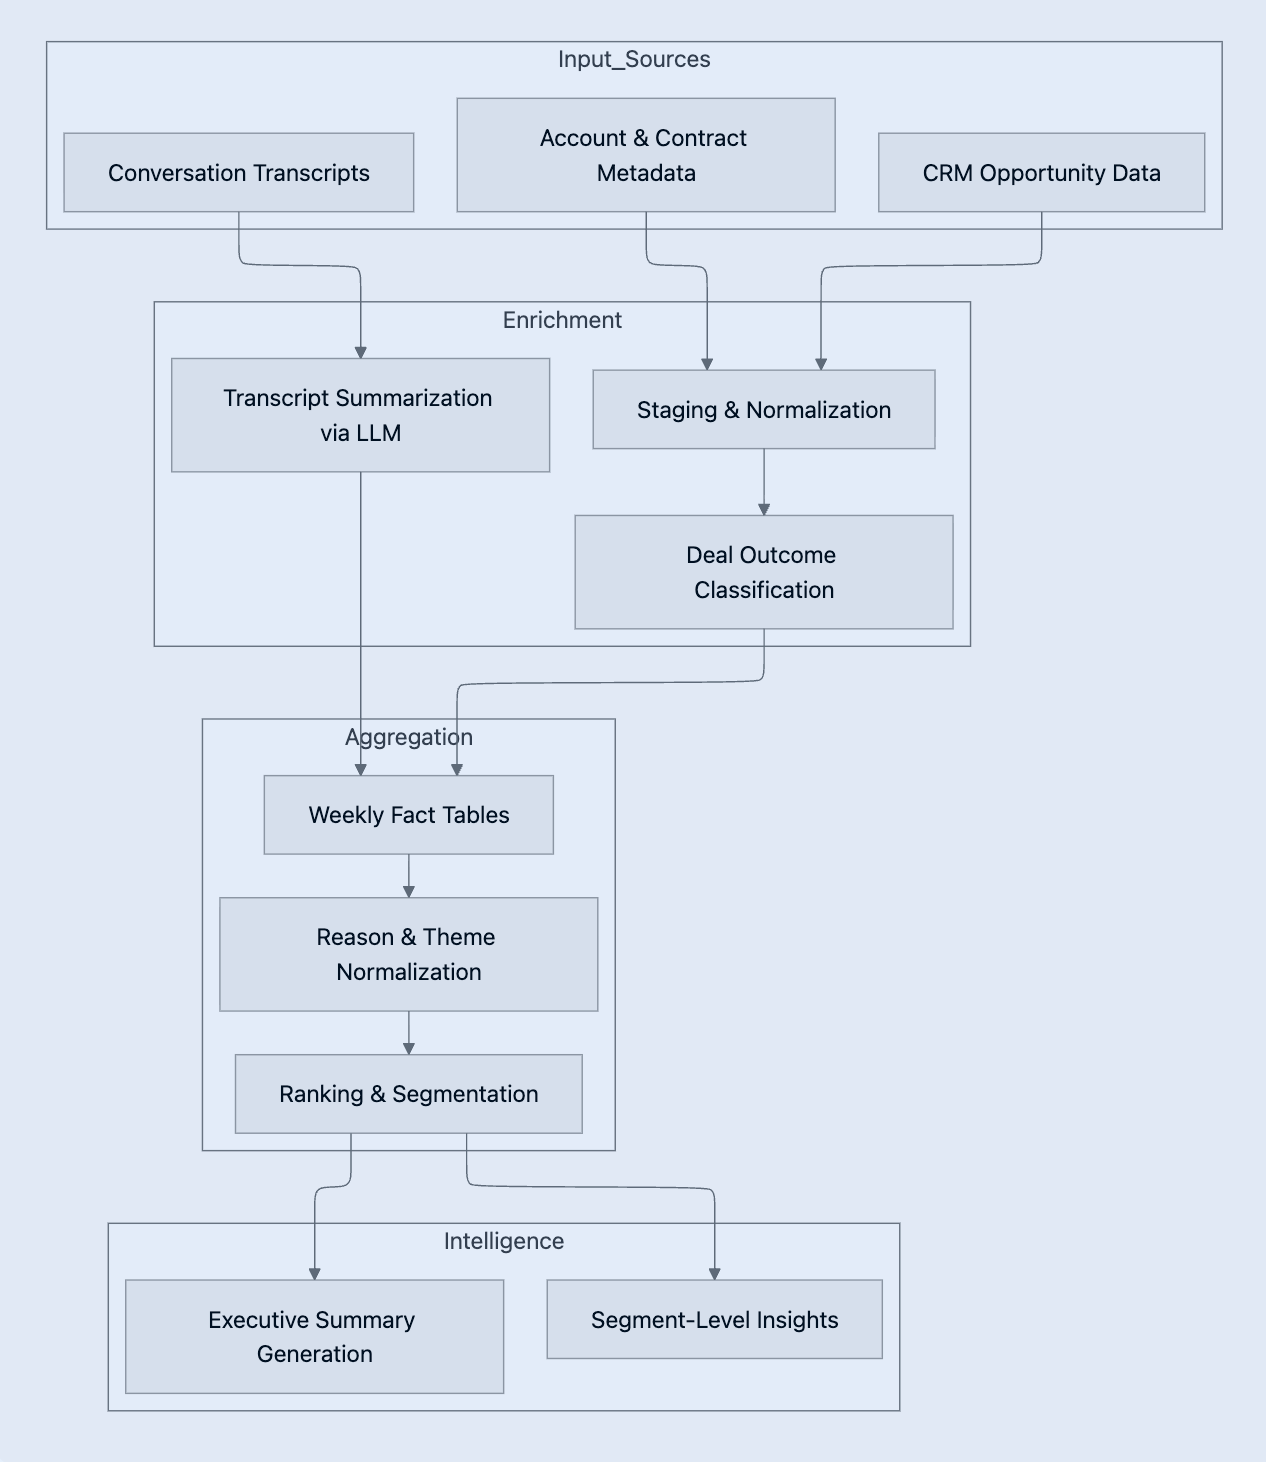
Snowflake serves as the backbone of the architecture. All raw ingestion, transformation, aggregation, and LLM execution happens inside the Snowflake data platform, with dbt used to express versioned business logic on top of Snowflake compute.
We built the solution around a clear separation of concerns. We normalize raw inputs first, enrich them second, aggregate them third, and only then translate them into narrative insight.
Normalizing Raw Signals with dbt
The foundation of the pipeline is a unified, deal-level dataset produced via dbt and executed inside Snowflake. Rather than optimizing for reporting convenience, we designed the schema to preserve semantic clarity and lineage.
Each closed opportunity is represented as a single authoritative record with explicit outcome classification, lifecycle context, and associated metadata. We retain raw attributes from upstream systems verbatim alongside normalized fields. This allows downstream consumers to trace every insight back to its original source without ambiguity.
We made a deliberate choice to keep text fields intact at this stage, storing free-text reasons, notes, and conversation references as-is, with no early aggregation or summarization. This ensures that enrichment and interpretation happen only after the data is properly scoped, classified, and validated.
We treat classification as a first-class transformation. We resolve deal outcomes, reporting categories, and lifecycle states deterministically in dbt models rather than inferring them later in dashboards or language models. As a result, downstream logic never needs to guess context. Every record arrives with its analytical intent already defined.
This schema design creates a stable contract between raw ingestion, enrichment, and narrative generation. By anchoring that contract in versioned dbt models, we ensure consistency across weeks while retaining the flexibility to evolve business logic as the system grows.
Enriching Unstructured Context with LLMs
Conversation data often contains the most valuable insights into why deals succeed or fail, and also the most noise. Rather than exporting transcripts to external services or pushing interpretation downstream, we introduced a constrained summarization step executed directly within Snowflake using a warehouse-available large language model.
For this stage, we use mistral-7b, which is available natively in Snowflake’s LLM execution layer. Running summarization inside the data platform allows us to keep unstructured data close to its source, apply enrichment at scale, and persist results alongside structured records without introducing additional systems or handoffs.
We selected mistral-7b because it performs exceptionally well at compression and extraction tasks with predictable latency and low output variance. At this stage, our goal is not reasoning or synthesis; rather, we are aiming for faithful distillation of long conversations into structured, high-signal summaries.
We materialize these summaries as structured records and treat them like any other analytical artifact. This makes them auditable, reproducible, and easy to join with downstream models.
De-Identified Transcript Summarization Prompt
Below is a sanitized, representative prompt used for transcript summarization. Identifiers, product names, and customer details are intentionally abstracted.
SYSTEM:
You are an assistant that extracts structured insight from sales conversations.

USER:
Summarize the following conversation transcript related to a CLOSED [WON | LOST] deal.

Context:
- Deal Outcome: undefined
- Customer Segment: undefined
- Evaluation Stage: undefined

Instructions:
- Focus on decision drivers, objections, and comparison factors
- Do not invent information
- Only use evidence present in the transcript
- Respond in valid JSON using the schema below

Schema:
{
  "primary_factors": [string],
  "objections": [string],
  "competitive_mentions": [string],
  "notable_quotes": [string]
}

Transcript:
undefined
This prompt design ensures outputs are predictable, bounded, and directly joinable to structured tables downstream.
Turning Reasons into Themes
We normalize free-text inputs into a controlled theme taxonomy using dbt models. This step transforms qualitative feedback into quantitative signal while preserving original phrasing for auditability.
By enforcing taxonomy governance at the data model layer rather than the UI or reporting layer, we maintain consistency across weeks and teams.
Weekly Aggregation as a Stable Interface
We compute all insights on a fixed weekly window. This produces stable aggregates such as top drivers, dominant themes, and segment-specific patterns. These tables act as a contract between analytics logic and narrative generation.
Executive Summary Generation with llama3.3-70b
We perform narrative synthesis directly within Snowflake using llama3.3-70b, a model selected for its ability to reason across multiple ranked inputs and produce coherent, structured summaries at scale.
At this stage in the pipeline, Snowflake acts as both the execution environment and the system of record. We invoke the model only against pre-aggregated Snowflake tables containing curated weekly metrics, themes, and segment breakdowns. The model never receives raw transcripts or transactional data.
By constraining the model to operate on warehouse-native aggregates, we ensure that executive summaries are deterministic, auditable, and fully traceable to the underlying data. The model’s role is strictly explanatory. It translates already validated signals into readable insight rather than performing exploratory or interpretive analysis.
De-Identified Executive Summary Prompt
SYSTEM:
You generate executive summaries from structured weekly analytics.

USER:
Using the data below, generate a concise executive summary.

Rules:
- Do not introduce new facts
- Use neutral, analytical language
- Follow the required section structure

Required Sections:
1. Executive Summary
2. Key Drivers
3. Strategic Implications

Weekly Inputs:
- Top Reasons: undefined
- Dominant Themes: undefined
- Segment Variance: undefined
- Competitive Context: undefined
Hard constraints like section headers and capped bullet counts dramatically reduce hallucination risk.
Schema Overview
The pipeline relies on a clear hierarchy of models. Below is a simplified schema view.
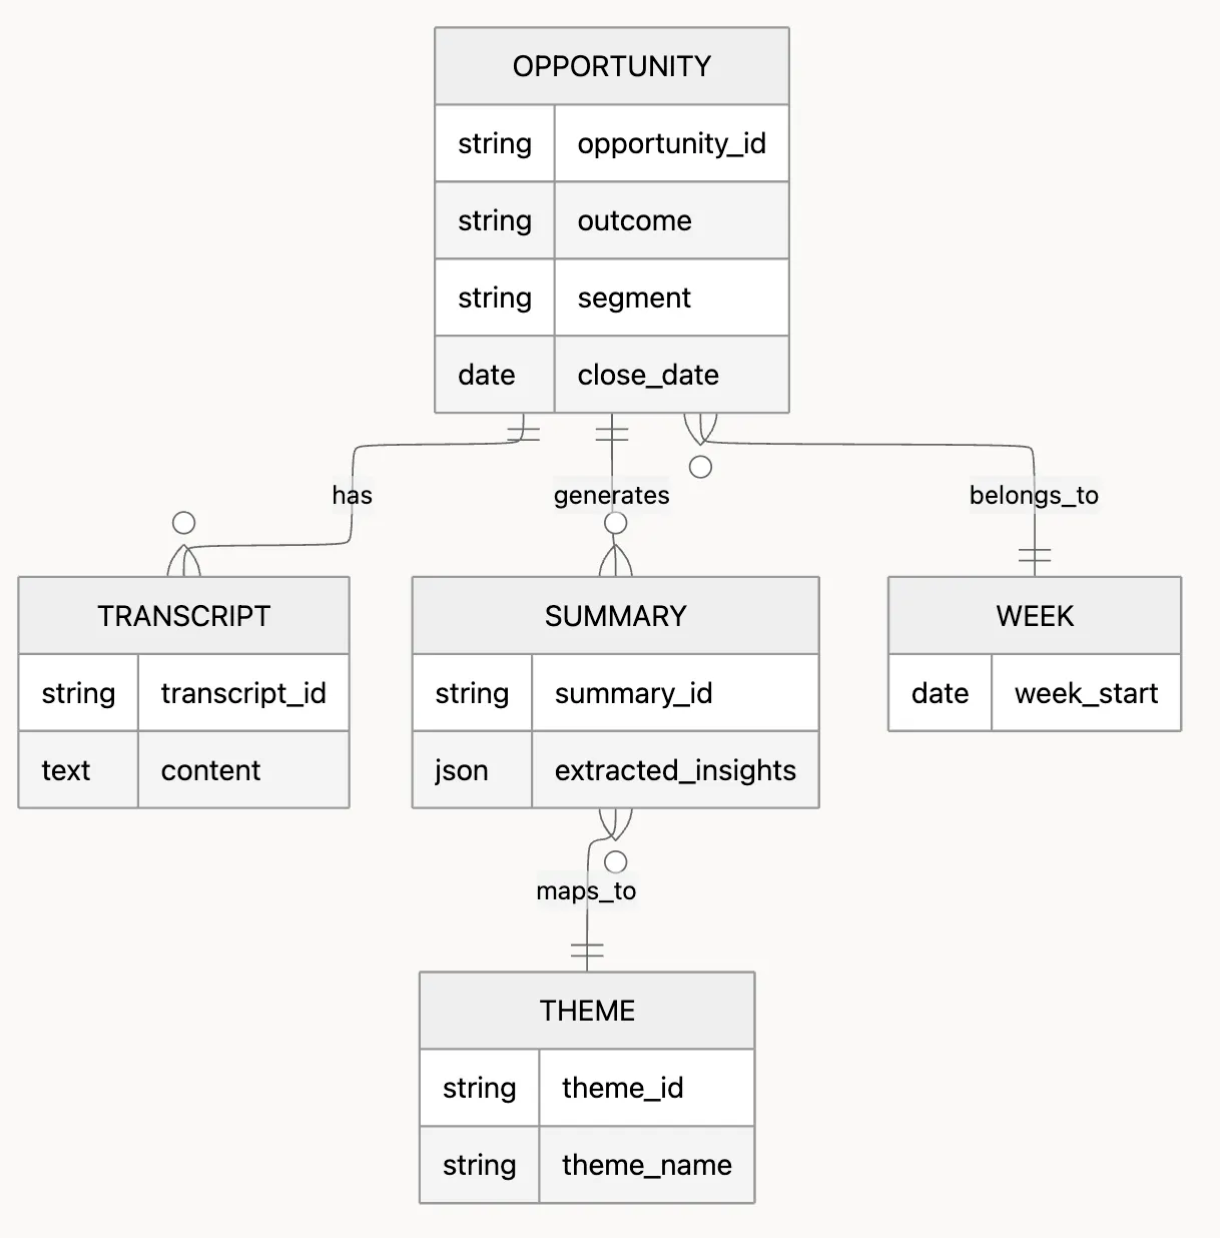
This schema ensures every insight can be traced back to a specific deal, transcript, and reporting period.
Closing Thoughts
Win/loss analysis is a systems challenge, not a reporting problem. By encoding judgment into dbt models and constraining language models to clearly defined roles, we turned a fragile, manual workflow into a durable, scalable intelligence platform guided by a simple principle: structure enables intelligence.
When data is disciplined and models are treated as components rather than analysts, even complex qualitative signals can be transformed into reliable insights.
This approach can be generalized and extended well beyond win/loss analysis to any domain where unstructured input must be converted into trusted, repeatable intelligence.